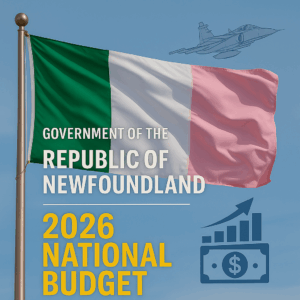
Republic of Newfoundland 2026 Budget

Ministry of Finance and Economic Planning

Budget 2026

Presented to the House of Assembly by the Minister of Finance, 1 November 2025.
Unless otherwise stated, all monetary amounts are in Newfoundland Dollars ($).

Preface

The Budget of the Republic of Newfoundland sets out the fiscal plan for 2026 and the forward years 2027–2028.
It aligns the nation’s resources with priorities in economic opportunity, maritime and Arctic sovereignty,
universal public services, and intergenerational stewardship through the Sovereign Fund.

Estimates tables accompany this web edition for transparency. Appropriations are subject to enactment
by the House of Assembly and review by the Senate.

Minister’s Foreword

Budget 2026 is a plan for steady growth, disciplined finances, and stronger national security.
With real GDP expected to expand by 2.3% and inflation trending toward the
Bank’s medium-term objective, we project a modest surplus in 2026 and
surpluses across the forecast horizon. The Republic will continue modernizing clean energy and fisheries,
expanding digital infrastructure, and—crucially—sustaining and improving our long-standing systems of
universal education and universal medical and dental coverage.

In an increasingly uncertain global environment, the Republic must be ready to defend its sovereignty and fulfill
its commitments to collective security. Accordingly, this Budget increases Defence outlays from approximately
3% to 4% of GDP — the largest readiness investment in a generation — to secure Newfoundland in a dangerous world
and ensure that we meet our NATO obligations. This includes the development of an expeditionary brigade combat team
and acquisition of the N39E Gripen long-range interceptor fleet to augment allied air patrols operating from
Goose Bay and Gander. These measures strengthen deterrence and guarantee that the Republic can contribute meaningfully to peace.

We proceed with prudence: maintaining debt at prudent levels, funding long-life assets, implementing
full royalties on hydro, LNG, oil, fisheries, forests, and critical minerals, and continuing rule-based
deposits to the Sovereign Fund.

— Minister of Finance and Economic Planning

Part I — Economic Context and Outlook

Global and Regional Setting

The global economy is expected to expand modestly in 2026 amid tighter financial conditions and
ongoing geopolitical tensions. Energy markets remain firm; shipping costs have moderated from recent peaks,
and advanced economies are converging toward low-to-mid single-digit nominal growth.

National Outlook

Newfoundland’s diversified Atlantic economy continues to benefit from hydropower exports, marine industries,
critical minerals, and data-center services. Private investment in hydrogen and rare-earth processing,
together with sustained public infrastructure, supports medium-term growth.

Table 1 — Key Economic Assumptions
Indicator 2025 (est.) 2026 (budget) 2027 (proj.) 2028 (proj.)
Real GDP growth (%, y/y) 3.2 2.3 2.4 2.2
GDP deflator / CPI (%, y/y) 2.8 2.5 2.4 2.3
Unemployment rate (%) 6.9 6.6 6.4 6.3
Nominal GDP ($ billions) 87.4 91.6 95.2 98.4

Note: 2025 estimate reflects latest in-year tracking. Nominal GDP 2026 incorporates real 2.3% and CPI 2.5%.

Risks

  • External demand: slower partner-country growth could weigh on exports.
  • Commodity prices: volatility in oil, LNG, and metals could affect revenues.
  • Security environment: elevated tensions in the Euro-Atlantic region require higher readiness and investment.

Part II — Fiscal Framework and Summary Tables

Fiscal Strategy

The fiscal anchor remains a balanced budget over the cycle, debt within prudential limits,
and predictable transfers to the Sovereign Fund. Budget 2026 plans a modest surplus
while prioritizing defence, infrastructure, and human capital—sustaining our established
universal education and universal medical and dental systems—within a framework of
full natural-resource royalties. The financial operations of the Labrador Hydro and
Industrial Electrification Plan are consolidated in this budget.

Table 2 — Summary Statement of Operations ($ billions)
2025 (est.) 2026 (budget) 2027 (proj.) 2028 (proj.)
Total revenues 32.3 35.2 36.3 37.3
Total expenditures (program + interest) 30.6 33.5 34.4 35.2
Budgetary balance +1.7 +1.7 +1.9 +2.1
Budgetary balance (% of GDP) +1.9% +1.9% +2.0% +2.1%

Revenues reflect full royalties on hydro, LNG, oil, fisheries, forests, and critical minerals; income and consumption taxes; Crown earnings; and investment income.
Expenditures include the maintenance and enhancement of Newfoundland’s long-standing systems of universal education and
universal medical and dental coverage, program spending, capital amortization, and interest.
The 2026 revenue uplift includes the consolidated net receipts from the Labrador Hydro & Industrial Electrification Plan.

Revenue Details

Table 3 — Revenues by Source ($ billions)
Source 2025 (est.) 2026 (budget) 2027 2028
Personal income tax 7.1 7.4 7.7 8.0
Corporate income tax 4.6 4.7 4.8 4.9
Consumption taxes 5.2 5.4 5.6 5.8
Resource royalties & dividends 8.9 9.1 9.3 9.4
Hydro & energy exports (Crown) 3.4 5.1 5.2 5.3
Other & investment income 3.1 3.5 3.7 3.9
Total revenues 32.3 35.2 36.3 37.3

Hydro & energy exports include consolidated receipts from Labrador power sales to domestic industry and foreign markets.

Program Expenditures

Program spending prioritizes Defence (rising to ~4% of GDP in 2026), health system capacity, education and skills,
marine and aviation infrastructure, fisheries science and enforcement, and digital public services.

Table 4 — Expenditures by Function ($ billions)
Function 2025 (est.) 2026 (budget) 2027 2028
Health & Social Development 6.2 6.6 6.8 7.0
Education & Research 3.9 4.1 4.2 4.3
Defence & National Security 2.8 3.7 3.8 3.9
Transport & Infrastructure 3.1 3.5 3.6 3.7
Energy, Mining & Environment 1.7 1.9 2.0 2.0
Fisheries & Maritime Resources 1.4 1.6 1.7 1.7
Innovation & Digital Affairs 1.1 1.3 1.4 1.4
Foreign Affairs 0.6 0.7 0.7 0.8
Other ministries & contingencies 6.1 6.6 6.9 7.0
Debt service 0.7 0.8 0.9 0.9
Total expenditures 30.6 33.5 34.4 35.2

Defence increases from ~3% to ~4% of GDP in 2026 to strengthen deterrence, secure Newfoundland in a more dangerous world,
and meet NATO obligations. The increase funds readiness, the expeditionary brigade, and the N39E Gripen interceptor fleet,
while maintaining personnel and veterans’ care commitments.

Debt, Sovereign Fund, and Reserves

Table 5 — Balance Sheet Summary ($ billions, unless noted)
Item 2025 (est.) 2026 (budget) 2027 2028
Gross public debt 24.0 25.1 25.4 25.6
Cash & liquid financial assets 8.5 8.7 8.8 9.0
Net debt 15.5 16.4 16.6 16.6
Sovereign Fund (market value) 235.0 251.2 260.2 269.2
Net debt (% of GDP) 17.7% 17.9% 17.4% 16.9%

The Sovereign Fund receives rule-based deposits tied to resource revenues; policy draws are capped at ≤3.5% of the five-year average market value
to preserve intergenerational equity. 2026 reflects higher rule-based inflows from consolidated Labrador hydro operations.

Policy Highlights for 2026

  • Defence: N39E Gripen long-range interceptor fleet procurement; expeditionary brigade stand-up;
    air and maritime domain awareness; munitions and sustainment stocks.
  • Fisheries & Marine: stock science, vessel monitoring & enforcement, value-added processing grants.
  • Infrastructure: port modernization, runways at Gander and Goose Bay, subsea cables redundancy.
  • Hydro & Energy Exports: consolidated Labrador hydro revenues integrated; 60% of net proceeds to SWF per rule.
  • Innovation & Digital: cloud services expansion on hydropower, critical-mineral refining tech,
    digitization of permits and customs.
  • Health & Education: clinical capacity, rural care incentives, apprenticeships and engineering seats.

Forward Path

The fiscal path preserves surpluses at or above 0.2% of GDP and maintains net debt on a gently
declining trajectory as a share of GDP. Priority investments will be financed within the planned envelope,
aided by efficiency measures and growth in Crown earnings.

PART III — Revenue Measures

All amounts are in Newfoundland Dollars (N$). Estimates are on an accrual basis unless otherwise noted.

1. Overview

The revenue plan for FY 2026 strengthens the base while remaining pro-growth and predictable.
Major categories — resource royalties, personal and corporate income taxes, GST/VAT, excise, and
non-tax revenues — are unchanged in structure, with targeted adjustments to improve equity,
compliance, and investment incentives.

Table R-1. Revenue Impact of New Measures (Full-Year Effects)
Measure 2026 2027 Ongoing
Increase high-income PIT threshold indexation cap to CPI +0.00 +0.00 Neutral
R&D super-deduction (125%) for targeted sectors* −0.10 −0.15 −0.15
Capital cost allowance — clean manufacturing (accelerated) −0.15 −0.20 −0.20
Offshore resource stabilization rule (no rate change)** 0.00 0.00 Neutral
Tourism VAT compliance & e-invoicing rollout +0.05 +0.08 +0.10
Excise floor on vaping and heated products +0.03 +0.03 +0.03
Total −0.17 −0.24 −0.22

* Eligible sectors: hydrogen, data centers using renewable power, battery materials, advanced fisheries/biotech, aerospace.
** Royalties continue to flow to the Consolidated Fund; windfall portions are transferred to the Sovereign Fund automatically under the rule.

2. Personal Income Tax (PIT)

Brackets remain unchanged in 2026. Indexation is capped to CPI to avoid bracket creep while preserving real progressivity.
Family and caregiver credits are increased 3.0% to reflect price levels.

Table R-2. PIT Schedule (Taxable Income, 2026)
Bracket Taxable Income Rate
Basic 0 – 45,000 10%
Middle 45,001 – 120,000 18%
Upper-middle 120,001 – 250,000 24%
Top 250,001 and above 29%

3. Corporate Income Tax (CIT)

  • General CIT rate maintained at 18%.
  • Small Business Rate: 9% up to N$1.5 million of active business income (phase-out to N$2.5 million).
  • Resource Surtax: no change to marginal rent capture; stabilization rule continues.

4. Indirect Taxes & Fees

  • GST/VAT standard rate unchanged; e-invoicing phased for accommodation, tours, and short-term rentals.
  • Excise: health-motivated floor introduced for new nicotine products; fuel excise frozen in real terms.
  • Air navigation & overflight fees adjusted to ICAO-aligned cost recovery (no general increase for scheduled carriers).

PART IV — Expenditure Plans by Function and Ministry

Program spending for 2026 remains at 33.5% of GDP, sustaining Newfoundland’s established universal education and universal medical & dental systems,
with defence rising from ~3% to ~4% of GDP to meet alliance commitments and Northern air-sea sovereignty tasks.
Debt service is projected at 0.8% of GDP.

Table E-1. Program Expenditure by Function (2026, N$ billions)
Function Amount % of GDP
Health & Social Development 6.6 7.2
Education & Research 4.1 4.5
Defence & National Security 3.7 4.0
Transport & Infrastructure (ex-capital) 3.5 3.8
Fisheries & Oceans 1.9 2.1
Energy & Environment 1.6 1.7
Economic Development & Industry 1.3 1.4
Municipal & Regional Transfers 0.7 0.8
Capital program (pay-as-you-go) 6.6 7.2
All other, reserves, contingencies 2.7 3.0
Total program (excl. interest) 32.7 35.7

Defence & National Security (N$3.7B)

Newfoundland’s Defence allocation rises from roughly 3% to 4% of GDP in 2026 — a deliberate and strategic
increase to secure the Republic in a more dangerous world and ensure readiness to meet NATO obligations.
This funding underwrites the modernization of forces, establishment of an expeditionary brigade, and the procurement
of N39E Gripen long-range interceptors to defend the nation’s airspace and support collective security in the North Atlantic.

Table E-2. Defence 2026 — Major Allocations
Programme Amount Notes
Air Sovereignty & Interceptors 0.95 Acquisition & training pipeline for N39E Gripen long-range interceptors; Gander & Goose Bay upgrades; NORAD/NATO-compatible C2.
Maritime & Coastal Command 0.62 Offshore patrol vessels, maritime ISR drones, undersea surveillance nodes; Arctic/Grand Banks coverage.
Army & Expeditionary Brigade (light-mechanized) 0.58 Formational HQ, prepositioning, protected mobility, indirect fires, logistics, medevac.
Cyber Defence Command 0.28 National SOC, red/blue teams, critical-infrastructure exercises with energy and telecom.
Integrated Air & Missile Warning 0.35 Long-range radar refresh, data-link modernization, joint exercises with allied squadrons.
Personnel & Readiness 0.72 End-strength growth, pay & benefits, recruiting, reserve incentives, housing at key bases.
Research, Trials & Indigenous Participation 0.20 Cold-weather trials; northern partnerships with Labrador communities for SAR and patrol auxiliaries.
Total 3.70

The interceptor fleet replaces legacy airframes and augments allied quick-reaction alert. Initial operating capability is targeted within 36 months; full operating capability within 60 months, aligned with infrastructure works at Gander and Goose Bay.

Health & Social Development (N$6.6B)

  • Primary care expansion, surgical backlogs reduction (multi-year targets), oncology and cardiac capacity.
  • Rural and northern telemedicine nodes; mobile diagnostics for Labrador and outports.
  • Social supports: indexed child benefit, housing partnerships, addictions & mental-health initiatives.

Education & Research (N$4.1B)

  • Class-size and literacy investments, teacher recruitment and retention initiatives.
  • Memorial University & Northern campuses: ocean engineering, Arctic medicine, AI for fisheries and logistics.
  • R&D co-funding with industry; scholarship expansion in STEM and trades.

Transport & Infrastructure (N$3.5B)

  • Highways: safety upgrades, winter resilience corridors, bridge renewals.
  • Airports & navigation: runway and ILS refurbishments, apron de-icing plants at priority fields.
  • Ports: cold-chain modernization, green shore power, harbour dredging in key fishing communities.

Fisheries & Oceans (N$1.9B)

  • Science-based quotas, stock assessment AI, enforcement, and value-added processing incentives.
  • Marine biotech grants; MSC-aligned certification expansion; vessel safety and training.

Energy & Environment (N$1.6B)

  • Hydro refurbishment, grid interties, hydrogen pilots, REE permitting capacity.
  • Watershed protection, forestry regeneration (2:1), climate adaptation for coastal infrastructure.

Economic Development & Industry (N$1.3B)

  • Battery materials & clean-metals clusters; tourism marketing and air-access development.
  • SME financing, export readiness, and film/digital creative industries support.

PART V — Capital & Infrastructure Plan (2026–2030)

The five-year capital envelope totals N$30.2 billion, funded by a mix of pay-as-you-go appropriations,
concessional borrowing well below the debt ceiling, and user-funded authorities (air navigation, ports, data corridors).

Table C-1. Major Capital Initiatives
Project Five-Year Funding Model 2026 Milestones
N39E Gripen Interceptor Facilities & Radar Chain 7.2 Appropriation + allied cost-share Hangars, fuel farms, radar sites RFPs; commence runway works (Gander & Goose Bay)
Ports & Cold-Chain Modernization 4.0 Appropriation + user fees Cold storage in St. John’s & Corner Brook; shore power pilots
Highways & Bridges Renewal 5.1 Appropriation Priority bridges; winter corridors upgrades
Hydro Refurbishment & Grid Interties 6.3 Utility capex; regulated returns Turbine refresh; HV links environmental approvals
Data Corridor & Subsea Cables 3.1 Public-private; anchor tenancy New landing station permitting; duct banks
Airports & Navigation Upgrades 2.5 Appropriation + fees ILS/lighting packages; de-icing plants
Public Buildings & Housing Partnerships 2.0 Appropriation + community housing funds Energy-efficient builds; regional health hubs
Total 30.2

Labrador Hydro and Industrial Electrification Plan

As of 2026, the Republic’s hydroelectric capacity in Labrador totals 8.9 GW of a technically feasible
10.2 GW. The remaining potential—principally at Gull Island and upper Churchill expansions—remains available for
future development subject to environmental and market review.

The 8.9 GW system produces approximately 45 TWh per year under normal water conditions. Domestic industry—principally
smelters, refining, hydrogen and steelmaking, and data services—consumes around 28 TWh, leaving an exportable
surplus of 17 TWh per year. Exports flow via high-voltage links to Nova Scotia and New Brunswick (target 1.0 GW),
the New England U.S. (target 1.0 GW), and Ireland (target 1.3 GW), with an optional extension to the United Kingdom (0.7 GW).

Financial Summary (2026 budget basis, N$ billions)

Item Amount Notes
Generation capital (historical + completion) 42.0 All Labrador sites to 8.9 GW
Transmission & export interconnects 14.5 HVDC to NS/NB, NE U.S., Ireland
Annual O&M (steady state) 1.1 Including refurbishments
Annual export revenue (17 TWh × N$ 90/MWh) 1.53 Gross receipts
Industrial sales (28 TWh × N$ 55/MWh) 1.54 Domestic users incl. smelters
Total revenue 3.07
Less O&M, depreciation & finance −1.25
Net fiscal contribution +1.82 ≈ 1.9% of GDP
Transfer to Sovereign Fund (rule-based 60%) 1.09 Stabilization and intergenerational equity
Consolidated Fund (general revenue) 0.73

These operations make hydroelectric exports one of Newfoundland’s largest sources of foreign revenue. 60% of net proceeds are automatically
transferred to the Sovereign Wealth Fund under the resource-stabilization rule. An additional 1.3 GW (bringing the system to 10.2 GW)
could be developed in the 2030s should markets justify expansion.

PART VI — Debt Management & Sovereign Wealth Fund

1. Debt Strategy

  • Maintain net public debt within 25–28% of GDP, well below prudential ceiling.
  • Extend average term to maturity; increase fixed-rate share to reduce rollover risk.
  • Preference for domestic-currency issuance; opportunistic buybacks when spreads allow.

2. Sovereign Wealth Fund (SWF)

The SWF stands near N$247 billion at end-2025. The rule-based draw is capped at 3.5% of the average
five-year market value, preserving real capital. Windfall resource receipts above the reference price
are transferred to the SWF automatically.

Table S-1. SWF — Sources & Uses (2026)
Item N$ billions
Opening market value (est.) 247.0
Net inflows (rule-based) 4.3
Investment income (long-term assumption) 8.4
Policy draw (≤3.5% cap) −8.5
Closing market value (proj.) 251.2

PART VII — Annexes

Annex A — Economic Assumptions

Variable 2025 2026 2027
Real GDP growth 3.2% 2.6% 2.3%
GDP deflator 2.2% 2.0% 2.0%
CPI inflation (avg.) 2.8% 2.3% 2.2%
Unemployment rate 6.9% 6.6% 6.4%
Brent oil (US$/bbl, ref.) 78 75 74
Hydro export price (reference, Ireland) €90/MWh €85–95
Hydro export price (reference, NE/NY) $65/MWh $60–75

Annex B — Consolidated Fiscal Tables

Table A-1. Consolidated Statement (N$ billions)
2025e 2026p
Total revenue 32.8 35.2
Total expenditure (incl. interest) 32.3 33.5
Budget balance +0.5 +1.7

Annex C — Glossary

  • CPI: Consumer Price Index.
  • Deflator: Broad price index for GDP.
  • Pay-as-you-go: Capital funded from current revenues.
  • Stabilization rule: Royalty windfalls to SWF above reference price.
  • LHIEA: Labrador Hydro & Industrial Electrification Authority (consolidated).

Statistical revisions may alter historical series. Departmental Main Estimates constitute the legal spending authority
once enacted by the House of Assembly.

Contact

Budget Office, Ministry of Finance and Economic Planning
Email: budget@republicofnewfoundland.com